With OIC on OCI we get a plethora of monitoring capabilities; we also have the ability to analyse logs and naturally push data to other analytics services such as Oracle Analytics Cloud. all of us are, hopefully, very familiar with the OOTB monitoring features of OIC. This post goes a little deeper to see what's on offer at OCI level. This post discusses the OIC Metrics available at OCI service level. It also looks at the OCI Logging Analytics service and the value-add it provides. So let's get going!
The above dashboard is a simple and basic example of what one can do with OIC logs in OCI Logging Analytics service.
There are 2 sources for the data shown above - let's call them default and custom. Part 2 of my recent post discusses the former. You can check out the post here
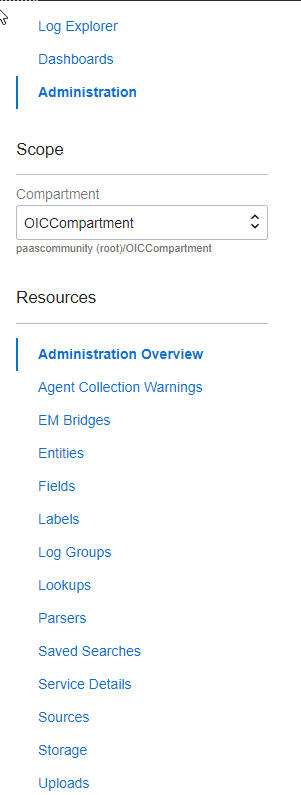
So now to Logging Analytics - here is the main menu -
Dashboards are what we're looking for - so let's create one
I give it a name and select a target compartment -
I see the empty dashboard and click the Edit button on the right - believe me - it's there!
I can now add Source Data to the dashboard -
This is what we get -
So where do these metrics come from? Let's return to the OIC Metrics at OCI Console level.
These metrics are available per default in Logging Analytics, but, before going there, let's look at what we can do with these OIC Metrics in Observability and Monitoring -
I can create an Alarm - e.g. notify me if there are more than 5 calls to the HelloWelt OIC Integration within a period of 5 minutes.
I test the integration 10 times and receive the notification -
I can also create a query and set an alarm in case of integration error -
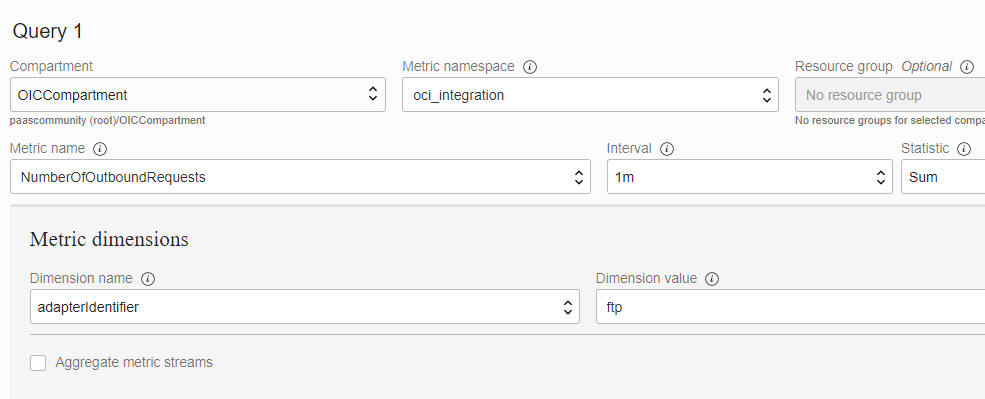
Also, I can get some intel on adapter usage - Here is a query to get the sum of ftp adapter calls made from OIC -
Back at Service Metrics level -
I look at the InboundRequestProcessingTime metric - and set an alarm for one of my integrations -
I note the average is over 2 secs - so I should be notified -
and I am -
Finally, one can add dimensions to the Service Metrics - e.g. I just want the metrics for a specific integration -
Net, net - there is a lot of value-add available here - Check it out!
My previous
post on this topic, discussed basic dashboards in OCI Logging Analytics, based on these metrics.
Back to the Dashboard graphic from the beginning of this post - the 3 circled areas source their data from the OIC Service Metrics, we just discussed.
I can also add other widgets, based on the Service Metrics - Here is one for one of my OIC integrations - Create Orders -
Now back to the 2 colourful widgets - let's check out the OIC Messages by Integration area -
Click on the top right icon to enter Log Explorer.
Here I see the underlying aggregated data. I also have the possibility to play around with the Logs - it is called Log Explorer, after all!.
I can use the fields available on the left -
Different visualisations are available, as you can see -
The data powering this and the other dashboard area - OIC Error Breakdown by Integration - comes from the OIC Activity Stream.
So how does the Activity Stream Log surface in Logging Analytics -
Step 1 - push Activity Stream to OCI Logging Service
Step 2 - create a Service connector to push log from OCI Logging Service to Logging Analytics -
Step 3 - take a look at the activity stream log structure - we will create a Parser in Logging Analytics for this.
The Parser will be based on this JSON format, but will require target fields -
I have already created these in Logging Analytics -
Now to the Parser -
I can test it -
Now let's apply this Parser to the Activity Stream Source -
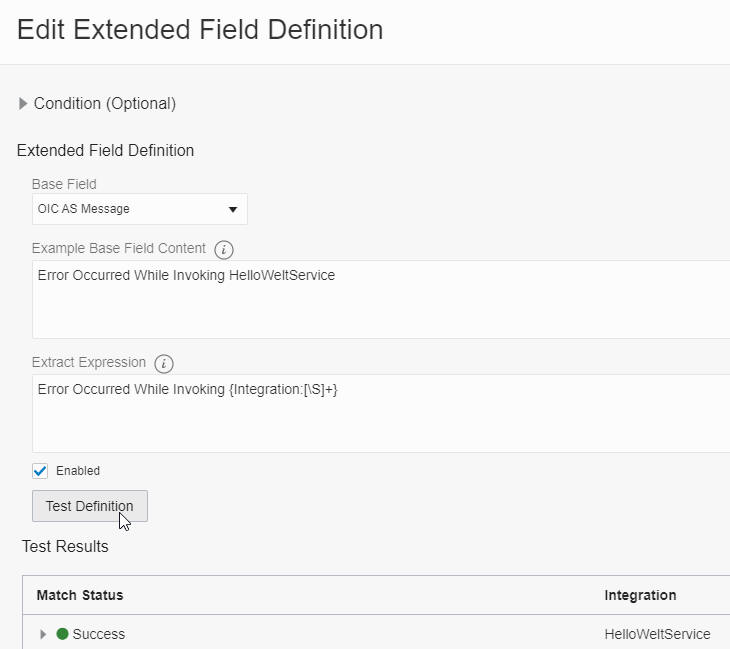
Note the ability to create extended fields - I do this to create a new field based on a regex. I use to extract Error details from the message field -
OIC runs as a native OCI Service, thus opening up a plethora of possibilities for us in respect of proactive monitoring and log analysis. I hope this post has whetted your appetite for such.


No comments:
Post a Comment