Tuesday, October 26, 2021

#888 Configuring OIC Notifications

Simple scenario here - customer wants OIC to send context sensitive emails in case of error. So what do I actually mean by this? I have ERP and HCM related errors, each of these will result in the sending of a notification. However, the ERP related email should have its own sender email address, email formatting etc. The same applies to HCM - Here is a simple example of such emails  - 


Note the 2 email addresses niallC@hcm.com and niallC@erp.com. These have been specified as valid email addresses in OIC - Settings - Integrations - Notifications

 
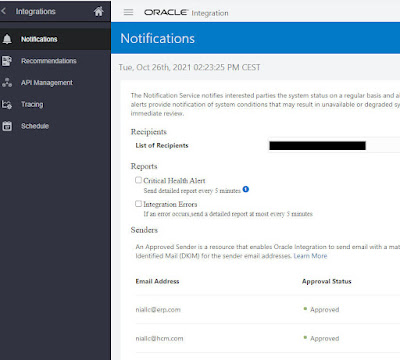
Now to the integration that will send the email. This will be part of your error handling framework.


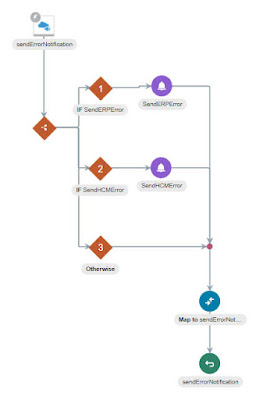
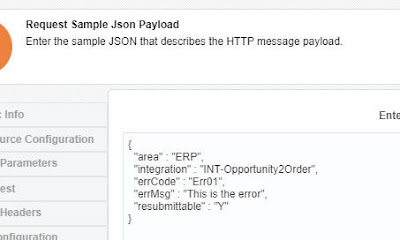
For this simple example I use the following request payload - 


Let's look at the SendERP Error Notification configuration - 


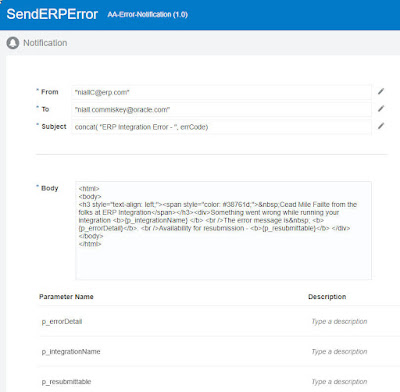
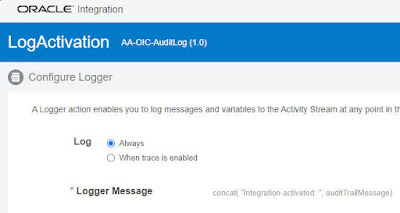
Note the use of html for the LOB look and feel. Also note the use of Parameters. These are set to the relevant values from the Request.

Very simple!


Tuesday, October 19, 2021

#887 Leveraging Grafana for OIC Metrics

OCI Logging and OCI Logging Analytics are compelling offerings, but some folks may have standardised on other monitoring tools, such as Grafana.


So no time like the present to look at how one can leverage Grafana to monitor OIC Service Metrics. My colleague Valeria C. has already done great work in this area and has provided me with the impetus to get started. But first, I need Grafana!  

Step1 install Grafana on an OCI Compute instance.

Step 2 install the Grafana OCI Metrics plugin.

Step 3 monitor!

Install Grafana on OCI Compute instance

1. Spin up a compute instance
2. ssh into the instance
3. install Grafana - currently we need a version under v8.


wget https://dl.grafana.com/enterprise/release/grafana-enterprise-7.5.11-1.x86_64.rpm
sudo yum install grafana-enterprise-7.5.11-1.x86_64.rpm

4. Start Grafana - sudo systemctl start grafana-server

5. create ssh tunnel so you can open Grafana on your local browser - 
putty.exe -ssh opc@yourComputeIPAddress -i C:\path2yourPrivateKey\ssh-key-private.ppk -L 3000:localhost:3000 

6.  Open Grafana in your browser - http://localhost:3000
login as admin/admin. You will then be prompted to change your password.


Add OCI Dynamic Group and Policies

This is required to allow the vm to collect OCI metrics - 


Rule: All {instance.id = 'yourComputeOCID'}


allow dynamicgroup yourDynamicGroup to read metrics in tenancy
allow dynamicgroup yourDynamicGroup to read compartments in tenancy

Install the Grafana OCI Metrics plugin

I manually download the plugin -


directory is /var/lib/grafana/plugins
cmd is wget https://github.com/oracle/oci-grafana-plugin/releases/download/v2.2.3/plugin.tar

create a directory and install -

sudo mkdir oci && sudo tar -C oci -xvf plugin.tar

Edit grafana.ini - adding the following - 


4. re-start Grafana
6. Open your browser - and go to Data sources. Here we configure the connection to OCI


Now I can start building a dashboard - 

I check out what's happening with my Hello World integration - 


 I also add a panel showing all integration messages etc. etc.

Net, net - very easy to configure and use. However, I still favour OCI Logging and OCI Logging Analytics. With them we have OOTB access to the OIC Activity Stream logs as well as the ability to create similar dashboards on top of the OIC Service Metrics.

Thursday, October 14, 2021

#886 Using OIC Logging Analytics for searching OIC Activity Stream log

 The OCI Logging Analytics version of post #884


So my OIC Activity Stream data is available in OCI Logging Analytics. Now I need to see what happened to order nr 2009. That order has been processed by OIC - 


Now over to OCI Logging Analytics - I just add "2009" to the query text box - 


So let's take this from the beginning - in Log Explorer - 


I then select the OIC Activity Stream Log - 


I then add the "2009" to the query - and see the order - 


Friday, October 8, 2021

#885 Surfacing OIC Design Time audit logs in OCI Logging Analytics

 The use case here is customer needs to see what is happening in respect of integration activation and deactivation.


The basis is the OIC Design Time Audit Log - visible in OIC Monitoring -


Note the action column values, activate, deactivate etc. Currently OIC does not push this log to OCI Logging, so the quick workaround here is to leverage the OIC REST api to retrieve the design time audit data - 


OIC REST API docs available here

I try this out in Postman, to get the response payload - 


Next step is to create a REST connection in OIC to OIC itself. 


This I then invoke from a Scheduled Orchestration - 


The logic, as you can very well see, is very simple. Just log all activate and deactivate messages.

Log Action is configured as follows - 


I then activate this integration, with tracing not enabled -


This will ensure only the LOG action messages are written to the OIC Activity Stream log.

Now to OCI Logging Analytics - note, I have already done the setup here for processing the OIC Activity Stream logs.

I open Log Explorer and configure the query as follows - 


OIC_AS_IntegrationFlowIdentifier = 'AA_OIC_AUDITLOG!01.00.0000' | fields -Entity, -'Entity Type', -'Log Source', -'Host Name (Server)', -'Problem Priority', -Label, -OIC_AS_IntegrationFlowIdentifier, OIC_AS_Message as 'Activation-Deactivation Messages'

OIC_AS_IntegrationFlowIdentifier and OIC_AS_Message are fields I have already defined in OCI Logging Analytics. Check out my previous posts here for details of OIC Activity Stream setup in OCI Logging Analytics.

I then save this to my OIC Dashboard - that's it. 
Very simple, very succinct!
 

Thursday, October 7, 2021

#884 Using OCI Logging for searching OIC Activity Stream Log


Scenario is as follows - I have an order processing integration used by many of my trading customers. Often they contact me to query what was actually ordered. I can use OIC Monitoring-> Tracking to fid the order, but what happens if the customer contacts me 3 weeks later? Maybe the data is no longer in the Activity Stream log. Here's where OCI Logging comes into play - Enabling OIC to send its activity stream log to OCI Logging is easy - 


Now to this simple demo order processing integration - 


The Hare of the Dog pub has ordered a keg of Guinness - whatever that is. But as we say at Commiskey Beer Wholesalers - the customer is always right. The JSON payload is transformed into XML for processing - 
I check out what the order looks like in the Activity Stream - 


Now to finding order 2112 in OCI Logging - 


As you see, I can specify compartment, Log Group and Log - I am only interested in the OIC Activity Stream, so I select that as the filter -

Here I see all the log entries, but I am only interested in OrderNr 2112. 

Here is the default query based on compartment/log group/log - 


Now I can augment this with a full text search for a string. I am looking for <orderNr>2112. - note the use of the 2 wildcards *- 


I see the content when I hover over the line with my mouse, unfortunately, it doesn't like screenshots.  
Again, hovering over "message" will show the order details. But, for the sake of this post, I will copy the contents of the message to notepad++


and there is the order -