As you can see, I am not a great one for graphics, but suffice to say - OIC can easily leverage other OCI services to provide you with the business/technical value-add you require. I will be focusing on OIC, API Gateway and Logging Analytics in this post. These are just a couple of the many services available with OCI.
Part 1 of the post focuses on the scenario of deploying OIC apis to the OCI API Gateway. From there we see what Logging Analytics Service provides us in respect of OOTB analytics on API Gateway traffic.
Part 2 focuses on the OOTB support provided for OIC by Logging Analytics.
Again, OIC is part of the OCI universe - the list below is not exhaustive, but I hope it gives you an appreciation of the OCI Platform.
Part 1 - OIC - API Gateway - Logging Analytics
We all appreciate the benefits of API Management -
- Security - Protect services
- Discovery - Promote functionality to developers and partners
- Monitoring - Understand how your services are used
- Management
So without further ado...let's look at managing OIC apis, using the OCI API Gateway. I will also cover getting intel from the api gateway logs. For those new to OCI API Gateway, I suggest you go thru my previous post on this subject.
In that post, I manually deployed the OIC api to the Gateway, that is now automated - has been for quite some time, i.e. you can create a connection to the Gateway in OIC and deploy the api, as part of the activation process.
Here is the Gateway -
I deploy at integration activation -
Then the API is actually deployed to the selected Gateway -
Now I can test this from Postman - for that I need the endpoint...
and then execute the GET request from Postman -
Now I add a throttling policy to this api -
I re-test in Postman, a couple of times and eventually get the message below -
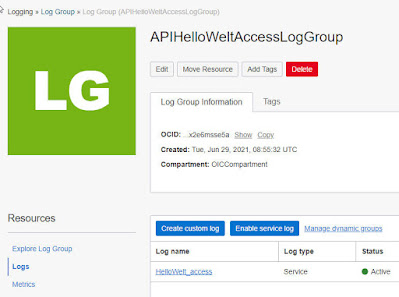
Note the 2 logs available - access and execution.
I also enable the execution log.
The logs and log groups appear in the Logging Service -
I kick off api requests from Postman - and check out the Metrics at API Gateway level -
Now to the logs -
details -
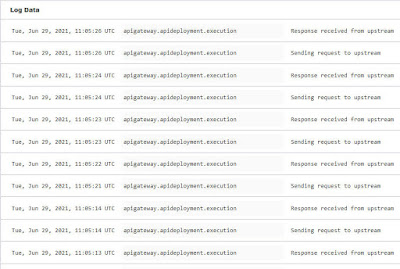
Here is the execution log -
details -
I could also push this data, i.e. the logs for this specific api, to Logging Analytics.
I will demo this for the access log. Here is the target in Logging Analytics -
Here is the Service Connector definition -
However, we already have OOTB integration between API Gateway and Logging Analytics at Gateway level.
Here is the list of OOTB API Gateway widgets -
I again invoke the OIC api many times via Postman - triggering the throttling policy -
I check the API access log - see how the error surfaces there -
I need to open the actual log details to find the 429 error.
Let's now look at the API Gateway logs in Logging Analytics -
Here is the content in more detail - note - the error is highlighted, no more searching needed here.
I add a couple and they are immediately surfaced in the output -
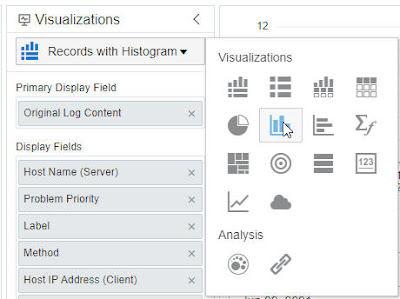
Various Visualisation options are also available -
Tá sé sin go han-mhaith, as we say in Ireland.
Here is what I see when I select the APIGW Access Status Distribution widget -
I can exclude all the successful calls from the search -
Other views -
I can focus only on errors-
Just to recap -
- OIC API deployed to the OCI API Gateway
- Ability to add gateway policies, such as the throttling option I demoed.
- Access to OIC thru the Gateway also virtualises the OIC endpoint for the service consumer.
- OIC api access logs pushed to Logging Analytics, giving us insight into who is using the api and whether errors have occurred.
Part 2 - OIC - Logging Analytics
Now to look at directly ingesting OIC logs into Log Analytics. Here a BIG THANK YOU to my esteemed colleague Cristian S. for pointing me to this feature.
Step 1 is to Create New Dashboard -
Step 2 is the Create Metric Widget -
This widget will need source data, which we will specify now -
Now I can drop these metrics into Y axis box -
Here is a simple example, showing successful and failed messages -
We can drill down further into the actual integration flows - I'm on a new OIC instance, where I have just 2 active integrations -
I created a new Dashboard in Logging Analytics, specifically for the SaveContact2File integration -
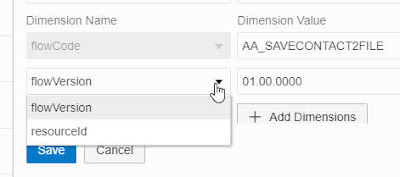
As you can see, one has the ability to add dimensions to the metrics, i.e. here I can specify the integration of interest to me from the MessagesReceivedCount -
The other Dimensions available include -
Note: I have set the Interval and Statistic -
Statistics include -
I must check on the meaning of P50 - P99.
Now I add the NumberOfOutboundRequests metric to the Dashboard -
This metric offers us the following Dimensions -
So here I can garner metrics on adapter usage.
add the metric, NumberOfInboundRequests, gives me access to the following Dimensions -
So, as you can see, pretty powerful stuff - now start Analyzing!


