
OCI Logging and OCI Logging Analytics are compelling offerings, but some folks may have standardised on other monitoring tools, such as Grafana.

So no time like the present to look at how one can leverage Grafana to monitor OIC Service Metrics. My colleague Valeria C. has already done great work in this area and has provided me with the impetus to get started. But first, I need Grafana!
Step1 install Grafana on an OCI Compute instance.
Step 2 install the Grafana OCI Metrics plugin.
Step 3 monitor!
Install Grafana on OCI Compute instance
1. Spin up a compute instance
2. ssh into the instance
3. install Grafana - currently we need a version under v8.

wget https://dl.grafana.com/enterprise/release/grafana-enterprise-7.5.11-1.x86_64.rpm
sudo yum install grafana-enterprise-7.5.11-1.x86_64.rpm
4. Start Grafana - sudo systemctl start grafana-server
5. create ssh tunnel so you can open Grafana on your local browser -
putty.exe -ssh opc@yourComputeIPAddress -i C:\path2yourPrivateKey\ssh-key-private.ppk -L 3000:localhost:3000
6. Open Grafana in your browser - http://localhost:3000
login as admin/admin. You will then be prompted to change your password.


Add OCI Dynamic Group and Policies
This is required to allow the vm to collect OCI metrics -

Rule: All {instance.id = 'yourComputeOCID'}


allow dynamicgroup yourDynamicGroup to read metrics in tenancy
allow dynamicgroup yourDynamicGroup to read compartments in tenancy
Install the Grafana OCI Metrics plugin
I manually download the plugin -
directory is /var/lib/grafana/plugins
cmd is wget https://github.com/oracle/oci-grafana-plugin/releases/download/v2.2.3/plugin.tar
create a directory and install -
sudo mkdir oci && sudo tar -C oci -xvf plugin.tar
Edit grafana.ini - adding the following -

4. re-start Grafana
6. Open your browser - and go to Data sources. Here we configure the connection to OCI

Now I can start building a dashboard - 
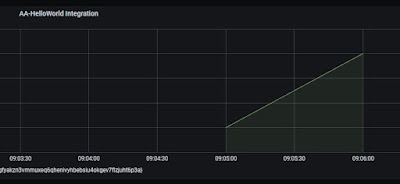
I check out what's happening with my Hello World integration - 


Net, net - very easy to configure and use. However, I still favour OCI Logging and OCI Logging Analytics. With them we have OOTB access to the OIC Activity Stream logs as well as the ability to create similar dashboards on top of the OIC Service Metrics.


No comments:
Post a Comment