The sync request concurrency limit is based on the number of message packs you have assigned to your OIC instance.
5 packs = 500 concurrent sync requests
10 packs = 1000 concurrent sync requests etc.
Net, net, you get 100 per pack assigned.
This service limit as well as the others are detailed here.
But how can we monitor this limit, e.g. see if we are in danger of hitting this?
OCI Service Metrics
Well try the following MQL from OCI Service Metrics for Integration -
NumberOfInboundRequests[1m]{resourceId = "<instance-id>"}.groupBy(serviceInstanceOcid).sum()/60 * InboundRequestProcessingTime[1m]{resourceId = "<instance-id>"}.groupBy(serviceInstanceOcid).mean()/1000
Here is a simple example in Service Metrics --> Metrics Explorer (Advanced Mode) -
I run some load tests and check the concurrency -
I check out the chart and see I'm up around the number 90.
Maybe a good idea to consider adding another message pack to this OIC instance.
OCI Alarms
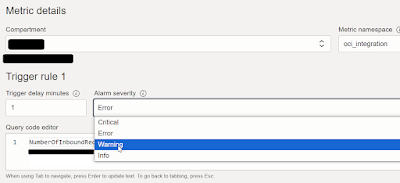
Let's create an alarm, based on this metric -
NumberOfInboundRequests[1m]{resourceId = "<instance-id>"}.groupBy(serviceInstanceOcid).sum()/60 * InboundRequestProcessingTime[1m]{resourceId = "<instance-id>"}.groupBy(serviceInstanceOcid).mean()/1000 >80
Now to defining the alarm target, in my case, I want to send an email to myself.
I run a couple of more tests from SOAP UI, ensuring I exceed 80. I then check my email -
I also receive an email when the alarm is no longer firing -
OCI Logging Analytics


No comments:
Post a Comment