

OIC Service Metrics are available via your OIC instance page in the OCI console.
The metrics names and description are as follows -

Let me start with a very simple example - a sync integration that waits a couple of seconds and then returns a success message -

Received messages shows 3,  same for Successful messages and Inbound requests - all set to 3.

The Inbound request processing time metric also surfaces.

I then check out Consumed messages (messages from a billing perspective) and see also 3

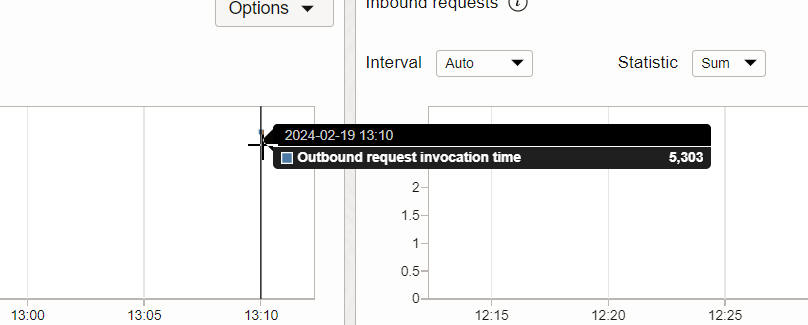
I now run another sync integration - this one invokes the ATP adapter to write a new order to my Orders table.


The metric for Outbound request invocation time also surfaces -
Finally, the one constant in all of this - Configured messages -

This shows the number of message packs assigned to this instance.
The next scenario includes a sync integration that invokes another sync integration -

I check the Messages failed count metric -

You will have seen the link to OCI Dashboards, while playing around with the Service Metrics -


I add a widget -


Then add a few more -

Let's create one on the Message Failed Count metric -


I run the integration 3 times, each time with an error.
I see the 3 errors on the alarm data tab -

I also get the relevant email -


No comments:
Post a Comment