Introduction
This post shows how you can use the OIC3 Factory apis to manage the lifecycle of your OIC projects.
I cover creating a project, applying RBAC to a project, activating project integrations, updating project connection configuration data, cloning a project, creating project deployment and export.
So, without further ado, let's begin.

Creating a Project
/ic/api/integration/v1/projects?integrationInstance=yourOICInstance

Request payload -
{"name": "MYPROJECT",
"code": "MYPROJECT",
"keyword": "createdViaAPI",
"description": "using Postman"}
Response -
{
"code": "MYPROJECT",
"description": "using Postman",
"id": "MYPROJECT",
"keyword": "createdviaapi",
"links": [],
"name": "MYPROJECT",
"origin": {},
"state": {
"assets": {},
"created": {
"by": "4b60...",
"date": "2025-02-24T07:34:37.620+0000"
},
"latest": {
"by": "4b60...",
"date": "2025-02-24T07:34:37.620+0000"
},
"lockStatus": false,
"locked": {},
"projectRevisionId": 0,
"serviceInstanceId": 0,
"status": "DRAFT",
"updated": {
"by": "4b60...",
"date": "2025-02-24T07:34:37.620+0000"
}
},
"type": "DEVELOPED"
}
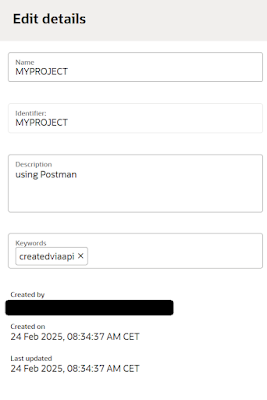
Check out the project is OIC - note that Created by is set to the client id of the confidential app, I'm using for OAuth.
Setting Project ACL
Here I want to specify my project as private, i.e. set myself as owner.
The api I will use is -

I can use the following api to retrieve the id -
/ic/api/integration/v1/identifies?integrationInstance=yourOICInstance

/ic/api/integration/v1/projects/MYPROJECT/acl?integrationInstance=yourOICInstance
The Request payload -
{"administrators":{"allowAll":false,
"allowed":[{"id":"9a1ab......",
"displayName":"Niall Commiskey",
"type":"user"}]}
}
There is no response.
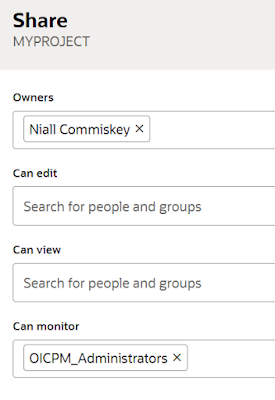
I check out the project in the OIC Designtime -

This is a private project, but I also want admins to be able to view the flows. Hence I need to set Can monitor.
Back to the same api - where I will specify who can monitor - here is the group I will use. This group data is also returned by the /identifies api mentioned above.

{"administrators":{"allowAll":false,
"allowed":[{"id":"9a1a...",
"displayName":"Niall Commiskey",
"type":"user"}]}
,
"monitors":{"allowAll":false,
"allowed":[{"id":"cdc9...",
"displayName":"OICPM_Administrators",
"type":"group"}] }
}

I validate in the OIC designtime -
Updating Project ACL
Say I want to change the monitor setting to Everyone -
{
"monitors":{"allowAll":true,
"allowed":[] }
}
Note, I must also set the "allowed" field to [ ].
{"administrators":{"allowAll":false,
"allowed":[{"id":"9a1a...",
"displayName":"Niall Commiskey",
"type":"user"}]}
,
"monitors":{"allowAll":true,
"allowed":[] }
}
Validate the result in OIC designtime -

Please note - the updateACL payload is expected to include all the different roles object like administrator, editor, monitor etc. If you do not send the data for a particular role, then it will be initialised, under the assumption that you want to remove that particular role setting.
Importing integrations into the project
Currently we can only export individual integrations from the global space, i.e. integrations not in projects.


Activating Integrations
The connection I imported is a REST Trigger, so is per default, configured. Ergo, I can go ahead and activate the integration - here I use the following api/ic/api/integration/v1/projects/{projectId}/integrations/{id}

My url is as follows -
/ic/api/integration/v1/projects/MYPROJECT/integrations/AA_SIMPLE_SYNC_WITHCHIL|01.00.0000?integrationInstance=myOICInstance
Note, integration id contains the version number. The response -
{
"apiDeploymentInprogress": false,
"compatible": false,
"links": [],
"lockedFlag": false,
"scheduleApplicableFlag": false,
"scheduleDefinedFlag": false,
"status": "ACTIVATION_INPROGRESS",
"tempCopyExists": false,
"totalEndPoints": 0
}
I validate in OIC designtime -
 Updating Connection Configuration


These I need to reset -


/ic/api/integration/v1/projects/MYPROJECT/connections/ORCL_DB?integrationInstance=myOICInstance
The request payload -
{
"connectionProperties": [{
"propertyGroup": "CONNECTION_PROPS",
"propertyName": "Host",
"propertyValue": "localhost"
},
{"propertyGroup": "CONNECTION_PROPS",
"propertyName": "Port",
"propertyValue": "1521"
},
{"propertyGroup": "CONNECTION_PROPS",
"propertyName": "SID",
"propertyValue": "ORCL"
}],
"securityPolicy": "USERNAME_PASSWORD_TOKEN",
"securityProperties": [{
"propertyGroup": "CREDENTIALS",
"propertyName": "username",
"propertyValue": "myDBUser"
},
{"propertyGroup": "CREDENTIALS",
"propertyName": "password",
"propertyValue": "myPwd"
}]
}
Note, the connectivity agent setting has not been wiped, so I do not have to set it.
The DB connection has now the state = configured, so I can activate the integration -
/ic/api/integration/v1/projects/MYPROJECT/integrations/CREATEORDERDB|01.00.0000?integrationInstance=myOICInstance
Integration is activated -

Cloning a Project
POST
/ic/api/integration/v1/projects/MYPROJECT/clone?integrationInstance=myOICInstance
{"code":"YOURPROJECT","name":"YOUPROJECT","description":"clone of template project, MYPROJECT"}
 Validate in the OIC designtime -

Project Deployments
My project currently contains 2 integrations -


{"name":"MYProjectV1",
"code":"MYPROJECTV1",
"description":"V1 deployment",
"integrations":[
{"code":"CREATEORDERDB",
"version":"01.00.0000"}
]
}
Validate in OIC designtime -

Here we will leverage the factory api to export, based on a deployment.
 Here is the request payload -
{"name":"MYPROJECT",
"code":"MYPROJECT",
"type":"DEVELOPED",
"builtBy":"",
"label":"MYPROJECTV1"}
I save the response to a local file -