Wednesday, February 22, 2023

#954 OIC and OCI Logging Analytics


One of the compelling advantages of OIC, apart from being the best EiPaaS ever, is it's membership of the OCI family. Today I am looking at OCI Logging Analytics and the value add it brings to OIC flow monitoring and log analysis. OIC itself does provide extensive monitoring capabilities and this is complemented by the analytical capabilities of OCI Logging Analytics, which I will often refer to as OCI LA. 

Firstly, a big thank you to my colleague, Valeria C. for her ideas and support here!

In respect of OIC, OCI LA has 2 main sources data souces -

  • OCI Service Metrics
  • OIC Activity Stream logs.

This post will cover how you can create rich dashboards for your OIC instances in OCI LA.

Before we begin - a quick review of OIC Logging levels - this is important as this determines what gets sent to OCI LA.

OIC Logging Levels


Production - All activities outside loops and invoke/logger activity inside loops (up to a 1000 iterations) are shown in the activity stream and this data is retained for a period of 32 days. 

Audit - Additionally wire payloads of trigger/invoke(s) are shown in the activity stream and this data is retained for a period of 8 days.

Debug - Additionally all payloads and all activities inside loops (up to a 1000 iterations) are shown in the activity stream and this data is retained for a period of 24 hours. It may slowdown your system and also pose a security risk as sensitive information from payload will be logged.

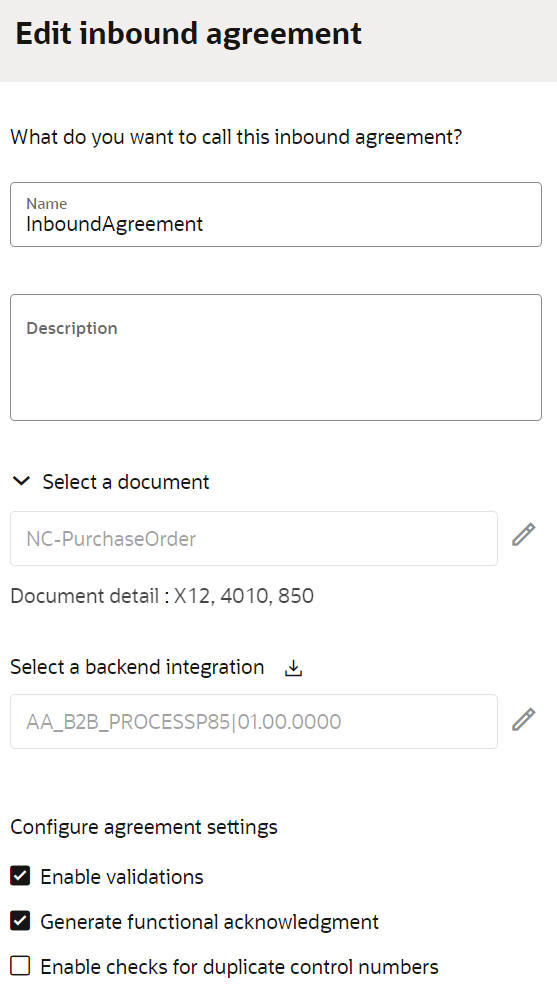
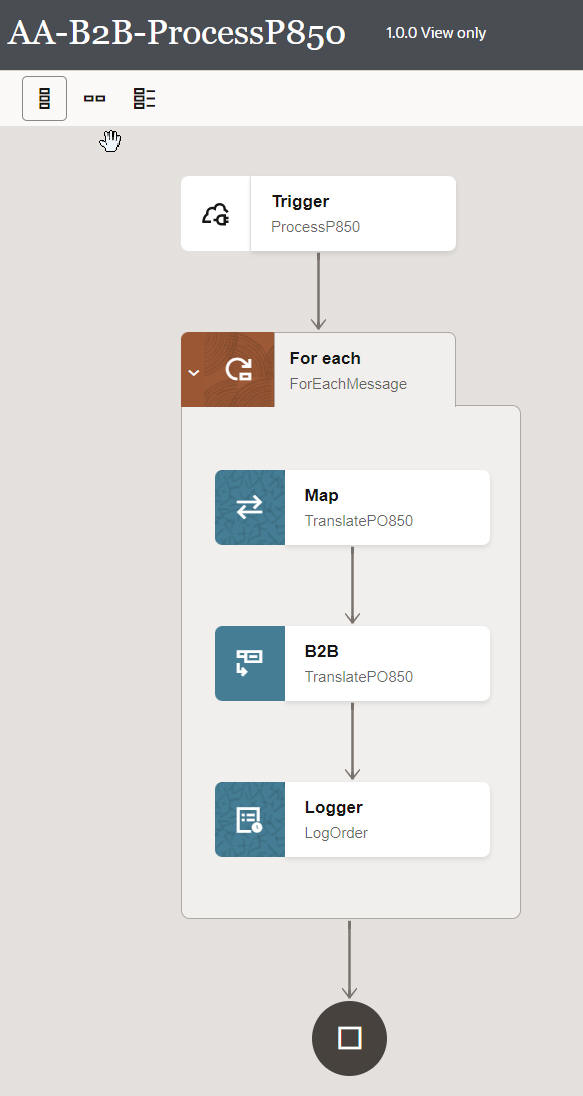
Here's a simple example of Audit output in OIC - this simple integration creates a customer in Netsuite.


Note, I see the payload passed to Netsuite - 


Now I activate the integration with Production level logging, I then run the same test - As you can see, only the activities executed are logged - no payloads etc.


Let's switch to OCI Logging and see what data we're getting there. Note, you can enable your OIC instance to auto-push the logs to OCI Logging.

OIC Logs in OCI logging


Here's the log for 1 of the createCustomer Netsuite flows, with trace set to production -


Let's check out the message structure - the salient content is in red. 

{

  "datetime": 1677082743000,

  "logContent": {

    "data": {

      "actionName": "CreateCustomerService",

      "actionType": "Receive",

      "executedTime": "2023-02-22T16:18:48.074Z",

      "instanceId": "lh_Dt7LMEe2W88lIN_tLLQ",

      "integrationFlowIdentifier": "AA_CREATENETSUITECU!01.00.0000",

      "message": "Message started processing",

      "userId": "NIALL..."

    },

    "id": "9629d681-b2cc-11ed-98ed-77be3985b31d",

    "oracle": {

      "compartmentid": "ocid1....",

      "ingestedtime": "2023-02-22T16:19:04.020Z",

      "loggroupid": "ocid1...",

      "logid": "ocid1.log.oc1.phx.amaaaaaajfhkgfyasvzbmk24tiizm5ybpcyoygwto4f6zaa5rtwfqdyuhbcq",

      "tenantid": "ocid1.tenancy.oc1..aaaaaaaagg3lwhfrb3klicoqffeacxqg6akvwadohdjlnoh262dnz7a3ak5q"

    },

    "source": "ocid1.integrationinstance.oc1.phx.amaaaaaajfhkgfya3ew3fmwmm2fzfqmcgre5pj6uqon2sdqolgbbqymbhdtq",

    "specversion": "1.0",

    "time": "2023-02-22T16:19:03.000Z",

    "type": "com.oraclecloud.integration.integrationinstance.activitystream"

  }

}

Let's look at the trace set to Audit and run -


Note, the payload is now available in the Message field - 


This is important, as this is also the log format in OCI Logging Analytics (OCI LA). OCI LA allows us to parse the logs so we could extract payload data from this field and use it in dashboards, e.g. top products ordered etc. 

You create a service connector in OCI Logging to push the OIC logs to OCI LA.


OCI Logging Analytics - Components


Dashboards - this is the main page for viewing/editing Dashboards -


Log Explorer - used for creating queries on top of logs e.g. the OIC logs. These queries can then be saved and visualised in dashboards.

Administration - manage the meta data, driving the dashboards. 


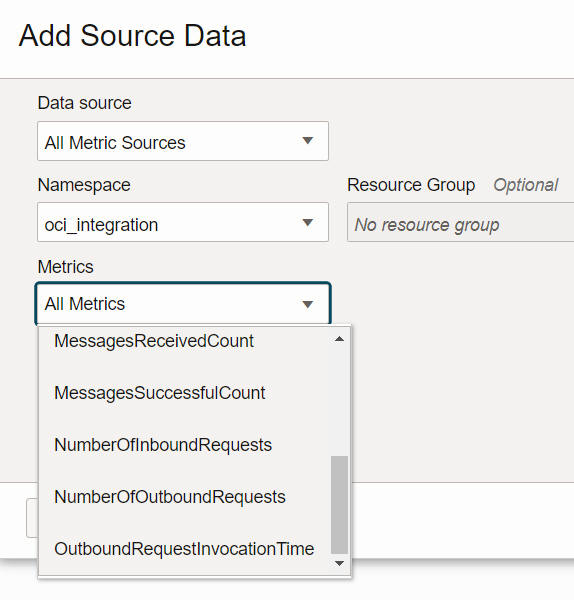
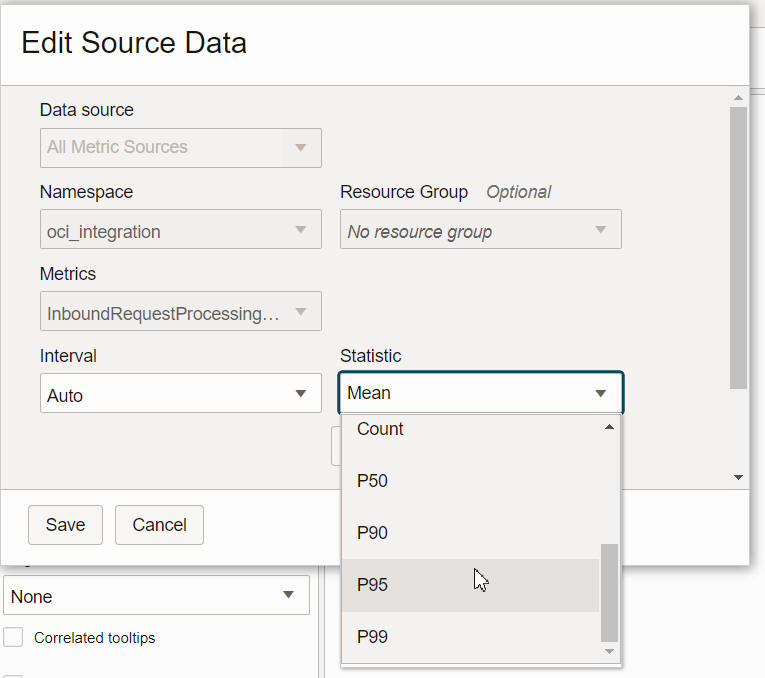
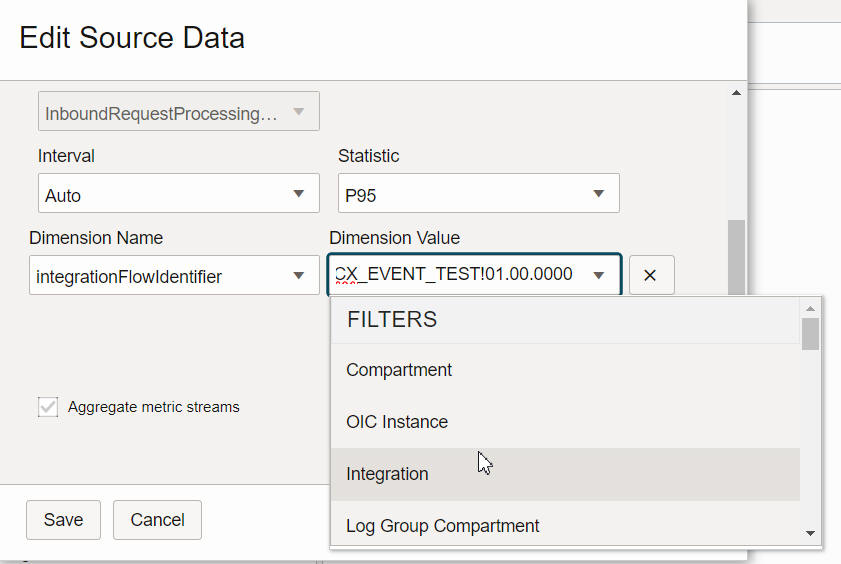
OCI Logging Analytics - Service Metrics Dashboard

OCI Service Metrics include the following - 


Here is a sample dashboard - 


Filters are a really cool feature in LA -


Consider we can push logs from multiple OIC instances to LA, filtering allows us to have a fleet overview, as well as the option to drill down into a particular OIC instance and even integration.

I have 2 OIC instances - Dev and Prod - 


I won't go into detail on all the widgets - but here is a quick intro - say I want the execution time metrics for a specific integration - 


I now select a specific integration and the widget updates - 


Now on to a Dashboard based on the OIC logs.

OCI Logging Analytics - OIC Log Dashboard


Let's look at these widgets in more detail -


These 3 widgets are self-explanatory - The rendering is via Tiles. The first tile gives us the count of OIC instances monitored. The second one shows how many flows have executed in the Dashboard timeframe. Note the trend graph here. Here is the actual query behind it - 


Here is the actual query - 'Log Source' = 'OCI Integration Activity Stream Logs' | stats distinctcount(Instance) as 'Flow Instances', trend(distinctcount(Instance))

Here is the menu in Log Explorer -

Save/Save as... also gives one the opportunity to save a query visualisation to an existing Dashboard.

Now on to some really cool widgets - 


Let's drill into this - 


This is available OOTB from OCI Logging Analytics - LA does some intelligent parsing of the logs, providing us with a great start in respect of error finding/resolution.

Here is another compelling widget - this provides me with intel on the execution times (duration) of my integrations over a period of time.  


For example - my Netsuite createCustomer integration - 


Dashboards can also be interactive - let's check this out with the following widget - 


Clicking on the icon brings me to Log Explorer - 

Note the query - 'Log Source' = 'OCI Integration Activity Stream Logs' | fields Message | fields Identifier, Action, 'Action Type', Instance, -'Log Source', -'Entity Type' 

Now say I want to search the logs for a specific string e.g. 123. I just need to amend the query as follows - 

'123' and 'Log Source' = 'OCI Integration Activity Stream Logs' | fields Message | fields Identifier, Action, 'Action Type', Instance, -'Log Source', -'Entity Type'


Summa Summarum

OCI LA is a must have for OIC Fleet Management. Try it out, today!

Wednesday, February 15, 2023

#953 OIC 23.02 Release --> New Features II

Part two covers -

  • Improved Monitoring
  • File Server
  • B2B
Connectivity and adapters have been covered by my colleague here

Improved Monitoring

The previous post detailed the Project specific Observability in OIC 3. Here's a quick recap - 


Clicking the Observe button in your Project shows you the monitoring data for integrations in that project. Note the doughnut graphic, giving you a succinct breakdown of the status of those flows.

So now to Observability per se - 


Before looking at the dashboard in more detail, let's check out the Integrations


Note, the default view above shows all integrations, including those from projects. 
I can also just view integration flows of a specific project, via the new Project filter -


Now to the Errors screen - 


Note, the project errors are included by default. I can also add a Project filter here - 


Now back to the Dashboard - I'm using an OIC 3 instance with a bit more throughput here - Check out the new Connections with Errors widget

I also see the list of integrations using this connection, in this case, I only have 1 using this Zendesk connection  -


File Server

File Server now supports additional algorithms. These algorithms are available in the Signature Algorithms field on the File Server Settings page. Previously, only the ssa-rsa algorithm was available previously.


B2B

B2B is now a part of OIC 3 - it is essentially the same functionality as in OIC Gen2.
Here is a simple example - 

Here I have a Trading Partner sending me X12 P850 documents (Purchase Orders).
So what are the steps?

Step 1 - Define the Host - 


Some of these identifiers will be used in the documents sent from the Trading Partner.

Step 2 - Define Trading Partners -


Commiskey_Inc is my trading partner - let's look at the configuration - 


Some of these identifiers will be used in the documents sent from the Trading Partner.

Step 3 - Define Transports -

In other words how will these P850 docs be transported. In my case, via FTP. 


Here I specify which FTP connection I will be using. I also enter the inbound ftp server directory I will use - in my case /b2b/in. So that's all I need for receiving docs.


The Transport definition continues with the sending information - note the ftp directory I will use is /b2b/out. I also set a format for the output files written.

The next section contains the auto-generated FTP Receive and Send integrations. Here you just enter a prefix and OIC does the rest. We will look at these integrations later. 

The Transport then needs to be deployed - 

I see the following menu options, as this transport has already been deployed - 


Step 4 Define Agreements - 

Transport sorted, but what will we be transporting? Yes, you got it -  X12 P850 PurchaseOrder docs. This is inbound, i.e. from Trading Partner to us (Host).


Note this refers to a document NC-PurchaseOrder - this I have already created via the B2B -> Documents menu option -


That's it - now to the integrations generated and the backend integration specified in the Agreements definition.


I begin with the auto-generated Receive integration - AA-B2B-CommiskeyInc FTP Receive

Here is the top level flow - 


First action is to list the files in the /b2b/in directory on my FTP server. Remember, I specified this directory, when creating the transport.

I expand the For each File loop - First step here is to download the file - 


Next Steps are as follows - 


B2B Translate - validates the incoming message and, if ok, invoke the backend integration for further message processing - we will look at that integration soon.


Here's the mapping - 


Now to the backend integration, which I knocked up in a couple of minutes - 


Here's the request payload I used - 

{
  "type" : "PO",
  "id" : "12345",
  "direction" : "INBOUND",
  "trading-partner" : "Acme",
  "document-definition" : "PO_850",
  "message" : [ {
    "b2b-message-reference" : "0AC400D117503A8246000000347849EB"
  }, {
    "b2b-message-reference" : "0AC400D117503A8246000000347849EA"
  } ]
}

Each Message is fetched and converted to XML -


Note the For Loop, iterating over the messages received. The only action I add here is a Logger action - 

This simply logs one of the P850 segment values - 


Now to testing - here is my ftp directory structure - 


Here is my test P850 document - 
ISA*00*          *00*          *ZZ*Commiskey_Inc  *ZZ*My Company     *230214*1204*U*00401*000000027*0*P*:~
GS*PO*My Company*Commiskey_Inc*20230214*1204*1027*X*004010~
ST*850*1027~
BEG*00*NE*MyOrder-1**20210614~CUR*2L*US *0001~
PO1*Bearing*30*A8*3~
PO1*LCD-015B*1*AE*129~
PO1*23A011*5*A8*11.6~
CTT*3*277~
SE*8*1027~
GE*1*1027~
IEA*1*000000027~

The value in bold is BEG03 - i.e. 3rd field in the BEG segment.

Let's test!


I run the Receive integration - 


I click on the link to view the activity stream of the backend integration - 


B2B Message Monitoring -


Now let's look at the raw messages -