OCI Logging Analytics is steadily establishing itself as THE tool for OIC Fleet Management. So I'm taking this opportunity to revisit this topic to make it even easier for OIC customers to adopt it. I will also look at the value add OCI Logging and OCI Dashboards bring to the table.
Let's begin by looking at the OCI Activity Stream itself. Here's a test of a simple synchronous integration, createOrder, which invokes a child integration, shipOrder.It's worth looking at a couple of the fields here, especially when we do a comparison with the subset pushed to OCI Logging.
automationRoot = "true" tells us this log entry is for the first activity of the integration, createOrder.
Note the "flowEventCreationDate": 1714137710739.
I convert this from epoch -
Also note the payload field - TriggerWirePayload_tTextPayload.
Pushing the log to OCI Logging is easy. You enable this from the OCI console page of your OIC instance.
Now to OCI Logging -
OIC Observability with OCI Logging
First thing I do is restrict the log search to my OIC log group, per default the search is set to the compartment.Here I see the activity stream log data.
I can also easily search for my orderNr - Rush2112.
Now to look at what's actually sent to OCI Logging -
Note the format is much more end user friendly. We see the same eventId - 8POu2APPEe-6pDMa9okTWQ. So this is the first log message for this integration invoke.
actionName: createOrder - the name of the trigger in the OIC instance
actionType: Receive - makes sense, this is the first action in the integration flow.
eventId: we've met this already, the unique id, assigned when the orchestration action is performed.
executedTime: In our case, it is "2024-04-26T13:21:50.739Z" - again match!
instanceId: flow instance id from OIC.
message: This field will have different values/formats, depending on the actionType. In the case of this Receive, it contains the JSON request payload.
opcRequestId: think of this as a GUID, which will be passed on to the child integration. This allows us to see the trace the business transaction flow over multiple integrations.
projectCode: the name of the integration's project, if applicable.
The other fields can essentially be ignored, from an analytics perspective.
When I do a search on "Receive", I see multiple rows for the combination of actionName/Receive -
The second message is for when the integration actually starts processing.
The third message is for the reply
There is also an advanced mode for defining queries - This will be important in respect of OCI Logging Analytics queries you create.
Here's my query -
search "ocid1....LogGroup/...ActivityStream" | data.integrationFlowIdentifier='CREATEORDERPROCESS!01.00.0000' | sort by datetime desc.
I can augment the query, check out the query language docs here
"ocid1....LogGroup/...ActivityStream" | data.integrationFlowIdentifier='CREATEORDERPROCESS!01.00.0000' | sort by data.executedTime asc
Note the key and value fields -
This data will be useful for more business oriented dashboards in OCI Logging Analytics.
Here's a query to get all of the 'Receive' log entries for createOrder -
| data.actionName = 'createOrder' and data.actionType = 'Receive'| sort by data.executedTime asc
Now a quick look at log groups -
Note the OIC_DEV_PM3LogGroup -
OCI Logging Connectors allow us to push data to downstream targets -
Note the OOTB targets supported -
We select Logging Analytics -
Note, I can send the OIC activity stream logs from all OIC instances, or I could restrict to 1+ instance(s).
Finally, to OCI Dashboards.
OCI Dashboards
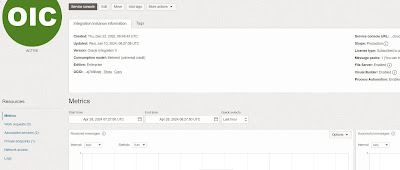
These can be seen in the OCI console page for your OIC instance(s) -
- Received Messages
- Successful Messages
- Failed Messages
- Inbound Request Processing Time
- Outbound Request Invocation Time
- Inbound Requests
- Outbound Requests
- Consumed Messages
- Configured Messages
I used the last 2 as the inputs to my billing widget above. So now let's create a simple metrics dashboard-
Next steps are to select the integration namespace and then the metric.
Final step is to select dimension -
- flowCode = Integration name
- flowVersion = Version number
- resourceId = OCID of integration instance
You can also create widgets based on the activity stream logs -
Note the link to the standard Logging Search -
The next task is to ensure the dashboards are accessible by the folks that need them -
Net, net - you can make this as granular as required e.g. grant users in a particular group access to all dashboards, along with the ability to create such, or else just read only access to specific dashboards.
OCI Logging Analytics
We've seen how OIC data is pushed to OCI Logging Analytics, now let's dig into the service.
But first, a couple of OCI Logging Analytics basics -
From an OIC perspective, Logging analytics has access to the OCI Service Metrics and the activity stream data from OCI Logging. Log data can be explored , hence the menu option - Log Explorer. Here one writes queries and specifies the graphical representation of the data. The latter is what then surfaces in the Dashboards.
I filter on Oracle Integration -
Here you see the 3 default OIC dashboards, delivered with OCI Logging Analytics.
Environments = OIC instances. Clicking on the filter icon (funnel) allows one to select one or more OIC instances.
Let's look at these -
Time Taken Analysis - Provides analysis of the Flow Execution time across integration versions and drill down to the time taken at Actions and Action Types level for integration instances.
Health Overview -
Note the richer widgets, compared to the standard OCI Dashboards.
It also includes some OCI Logging Analytics value-add, e.g. Potential Issues. Note the ability in the dashboards to drill down to the Log Explorer, i.e. explore the underlying logs and query behind the widget.
Here one can edit the query and, if required, save it for use as the basis of a dashboard widget.
These 3 dashboards can be edited, however, not directly. On needs to create a duplicate and then edit -
Here's an example for Key Metrics -
Naturally, I can create dashboards from scratch, based on my own Log Explorer queries.
Here's another query, based on OIC tracking fields. My createOrder integration has a tracking field call product, which is set to the name of the product ordered. Ergo, this query gives us a good overview of the products being ordered.
'Log Source' = 'OCI Integration Activity Stream Logs' | fields -Entity, -'Entity Type', -'Host Name (Server)', -'Problem Priority', -Label, -'Log Source', Key, Value, Instance, Integration | where Key = product
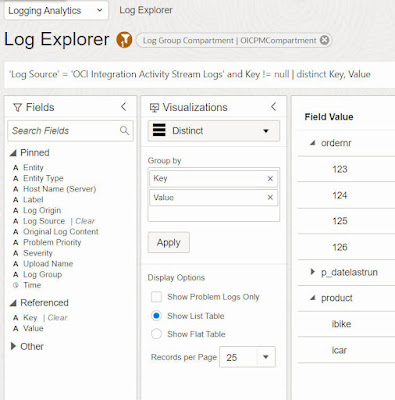
'Log Source' = 'OCI Integration Activity Stream Logs' and key != null | distinct key, value
Here's another variation, this time as a Pie -
I created this query via the UI, by just dragging and dropping the 2 fields - Key & Value - to the Value and Group by boxes.
There's a lot of stuff here, as you can see and I'll just go thru some of, what I see as, the most salient to our discussion -
The underlying query - 'Log Source' = 'OCI Integration Activity Stream Logs' | fields -Entity, -'Entity Type', -'Host Name (Server)', -'Problem Priority', -Label, -'Log Source', Key, Value, Instance, Integration | where Key = product | stats count(Key) by Value
Yet another variation, this time a BIG THANKS to my colleague Varun K, for his help here.
Here we group the tracking fields by the unique OPCRequestId, this is the GUID we discussed earlier.
'Log Source' = 'OCI Integration Activity Stream Logs' and Key != null | distinct 'OPC Request ID', Key, Value
Parsers - are key to OCI Logging Analytics. The services comes pre-seeded with many parsers, including that for OIC activity stream. The fields defined in the parser are the ones you can leverage in your Log Explorer queries. You can also create your own parsers.
Here I search the fields on 'OPC' -
'Log Source' = 'OCI Integration Activity Stream Logs' and Key != null | distinct 'OPC Request ID', Key, Value
Storage -
One pays for OCI Logging Analytics based on storage used -
I've been using Logging Analytics for a couple of years, with no purging, hence the 355 GB used. Net, net - a purge policy is useful here.Granting Access
How do I grant access to OCI Logging and OCI Logging Analytics? Imagine you have a set of users who need access to monitor OIC. These folks may not necessarily be OIC users or even current OCI users.
The simple steps are as follows -
- create user
- assign user to group e.g. OCILoggingAnalyticsGroup
- create IAM policies to grant the group access to OCI Logging, OCI Service Metrics and OCI Logging Analytics
- Allow group yourGroup to manage loganalytics-features-family in tenancy
- Allow group yourGroup to manage loganalytics-resources-family in tenancy
- Allow group yourGroup to read compartments in tenancy
- Allow group yourGroup to manage management-dashboard-family in tenancy
- Allow group yourGroup to manage logging-family in tenancy
- Allow group yourGroup to manage metrics in tenancy
Summa Summarum
OCI Logging, OCI Dashboards and especially OCI Logging Analytics are a huge value add for the OIC administrator. In fact, the latter is really a MUST for those tasked with monitoring multiple OIC instances.


No comments:
Post a Comment