Showing posts with label OCI Metrics. Show all posts

Monday, August 21, 2023

#982 OIC3 Service Metrics

 Service Metrics provide us the following stats -

  • Received Messages
  • Successful Messages
  • Failed Messages
  • Inbound Request Processing Time
  • Outbound Request Invocation Time
  • Inbound Requests
  • Outbound Requests
  • Consumed Messages
  • Configured Messages
Now these might all seem very straightforward, but let's go through a couple of examples to ensure 100% clarity. It is also worthwhile reading the docs on this subject here -


I begin by running a test of the following - Invoke of syncIntegration1.
syncIntegration1 invokes asyncIntegration1 which writes a row to an ATP table, then invokes asyncIntegration2. This integration does essentially the same  - writes a row to an ATP table, then invokes asyncIntegration3. The 3rd async integration just writes to ATP.

I do a load test from SOAP UI, invoking the sync integration 7500 times. Let's see how this looks from a Service Metrics perspective -

Received Messages

This is the default view - 
Interval set to Auto - Statistic set to Sum


I need to drill down, in order to see how many requests were received for which integration - 

Ergo, from an OIC "engine" perspective, I have received 30k messages - which is correct.

Takeaway - Messages Received statistic includes more than the initial client request to OIC.


Successful Messages 


I view in metric explorer -


Table view - 


30k requests successfully processed.

Inbound Requests


30k Inbound Requests

Outbound Requests


Drill down in Metric Explorer - 

Note local Invokes and the ATP invokes are treated as Outbound Requests.

This gives us 45k requests -

  • syncIntegration1 - 7500
  • asyncIntegration1 - 15000

  • asyncIntegration2 - 15000
  • asyncIntegration3 - 7500
  • Outbound Request Invocation Time

    Here best to drill down and check based on collocatedics (local invokes) or atpdatabase -


    Inbound Request Processing Time


    The official description of this metric - 
    The time taken for processing inbound requests. In case of synchronous requests, it is the total time taken for processing a request and sending the response. In case of fire-and-forget inbound requests, it is the time taken to persist the request and send the acknowledgment.

    This metric captures the time elapsed (in milliseconds) by the trigger in processing the incoming request.

    So this gives us the actual execution time stats for synchronous integrations. For asynchronous - it covers just the time take to queue the request for future processing - 

    So the only stat of interest for us here is that relating to the sync integration - 

    Async integration execution times can be found in OIC Observability - 


    Consumed Messages

    The billing perspective - 

    Again drill down for the hourly table view - 

    7500 billable messages for syncIntegration1.

    Configured Messages


    5k messages per hour, i.e. 1 message pack assigned to this instance; on this throughput though, I should be considering upping this to 2 message packs.

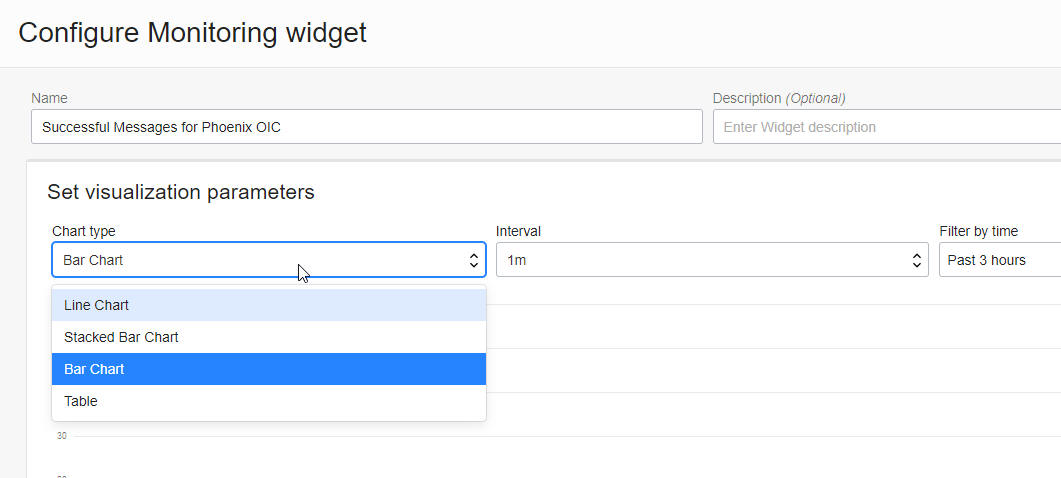
    These Metrics can be used to populate OCI Dashboards, which can be accessed easily, when you login to your tenancy - 


    I have built one, based on the billing and configured message pack metrics - 


    However, dashboard widgets can be based on more than the Service Metrics, we have been discussing - 


    Service Metrics are under the Monitoring section.

    Logging data table allows us to view the actual OIC logs sent to OCI.

    Resource Explorer gives us a nice overview of the resources in our compartment -


    Summa Summarum

    Service Metrics/ OCI Logging / OCI Dashboards give us excellent insight into what's going on in OIC.

    Check them out!


    Tuesday, August 30, 2022

    #928 - OCI Dashboards for OIC


    OCI Dashboards are a great value add to the OIC administrator's toolbox. The screenshot above shows base message statistics from multiple OIC instances, running in different regions; a boon for admins running OIC in multiple data centres.

    Before going into the details of creating such, how do I get there?


    The main OCI Logging page provides the link. 

    The Dashboard is composed of Widgets - here are the first three, based on Service Metrics - 


    I've covered Service Metrics in many previous posts - but, for the neophytes among you, I'll go thru the process. I click Add Widget - note the groups available. I will click Monitoring -   


    A new monitoring widget is added to my dashboard, all I need to do now is click Configure -


    I enter an appropriate name - note the visualisation options - 


    Now to the main configuration - note the ability to choose the region - 


    Note the Dimensions available - flowCode refers to integrations - so we could have a widget that jut renders this information for a specific integration - 

    flowVersion refers to the version of the integration e.g. 1.0.0.0

    resourceId refers to the OIC instance itself as I could have multiple OIC instances in the same compartment. Here is the result - 


    The next set of widgets refer to my Oracle Integration 3 in the Vinhedo region -


    Note that I am only billed on the 2 integrations - AA_MAIN and AA_CREATE_CUSTOMER

    However, note the other widgets, those covering actual messages processed, include another integration - AA_CHILD. This is because AA_CHILD is invoked locally by AA_MAIN, the return payload < 50kb, thus incurring no billing charges. The next set of widgets give us more details about the flows from my Phoenix OIC instance - 


    I have used the table visualisation to show the entries fro the OIC Activity Stream. The Dashboard user will be able to drill down into this data, using the OCI Log Explorer.
    The pie chart gives us a nice breakdown of integrations - so I can easily see where my resources are being spent - 


    Note the Group By here - 


    As you can see, I can also slice the data based on endpoint - data.endpointName.


    Let's return to the table displaying the OIC Activity Stream data from Phoenix - 


     Note the link - Open with Logging Search - here we can drill down into the log file contents. For example, let's search for a specific product, our excellent iBike. We have an integration that processes orders and the product is a request payload field.   

    We can enter an expression to search for that - the WHERE query is simple -  | where logContent = '*iBike*' |


    These searches can be saved - 


    Finally, let's look at individual adapter usage. My Oracle Integration 3 instance has integrations using the Netsuite adapter - 


    The Configuration is as follows - 


    Summa summarum, OCI Dashboards allow us to easily assemble dashboards on top of OCI Service Metrics and OIC Activity Stream logs.

    These dashboards are, in part, interactive, allowing users to drill down and explore the logs. These "explorations" can be saved for easy future access. 
    Try out OCI Dashboards and let me know what you think!