This is another compelling feature of OIC3, making it simple for you to see the number of billed messages per integration and get notified about such. For example you can set a threshold and get informed via email when that threshold has been reached.
I have the following simple integration that processes a large payload, large is relative, but, in my case, it's well over the 50kb limit for 1 billable message.
I run this 3 times in the tester and check the instance metrics in the OCI console -
Let's hone in on the Received Messages metric -
Now to the Billable or Consumed messages metric -
Now I look at the sum metric - 6 = 2 billable messages per integration test.
We can now drill down to the Metrics Explorer -
Here I can search for a specific integration -
Excellent stuff, back in OIC, I clone the integration and call the new one - AA-SometimesLargePayloadDemo.
I execute it 10 times, each time the payload is less than 50kb.
Drop down to Metrics Explorer -
Ergo, it is simple to check the billing for each integration.
Check the Advanced mode box on the metrics explorer page -
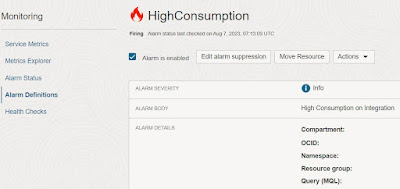
Here I can create an Alarm based on the billing metric -
Let's try it out - I run the integration multiple times - I check out the alarm -
I check my email -
I can also create an OCI Dashboard for these metrics -
Here's a screenshot of the complete dashboard -
I can also work with this widget in OCI Logging Analytics -
Here is the base query - BilledMessageCount[1d].grouping(integrationFlowIdentifier).sum()
1d = 1 day
1h = 1 hour
5m = 5 minutes
You get the idea.
Summary
OIC3 Billing metrics show you where your money is being spent. The metrics are available in your OIC instance page in the OCI console. You can also create an OCI Dashboard, based on this metric. Finally, you can also create more detailed dashboards in OCI Logging Analytics. Choose the best option for your requirements!


No comments:
Post a Comment