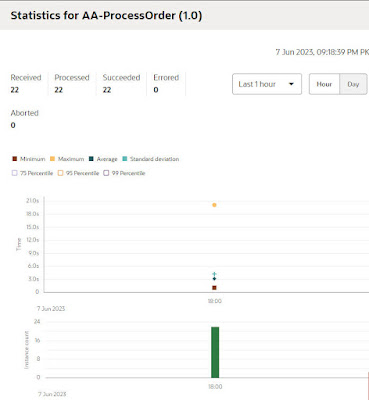
OIC 23.06 includes some very compelling enhancements in respect of Observability - You can now view the total counts and the minimum (quickest), maximum (slowest), mean, and standard (largest) deviation execution times of integrations over a selected time period.
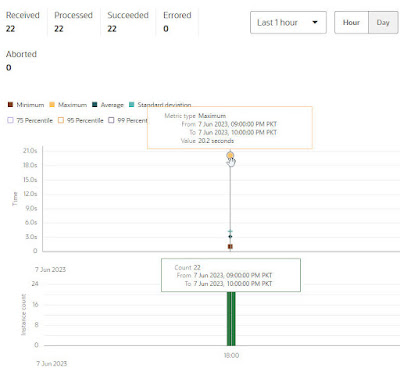
Here's a simple example - I'm checking out my integration AA-ProcessOrder - this synchronous integration is very simple, it includes a WAIT action (yet another new 23.06 - WAIT in sync flows) and a local invoke of a child integration. I include a wait field in the request payload, this allows me to vary the execution time. I execute 20+ requests, with the max wait time of 20 secs.
Now to OIC Observability - note the new View statistics icon -
I can exclude/include metrics as required -
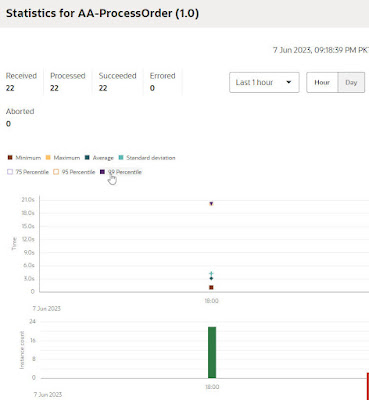
Same applies to the percentile metrics -
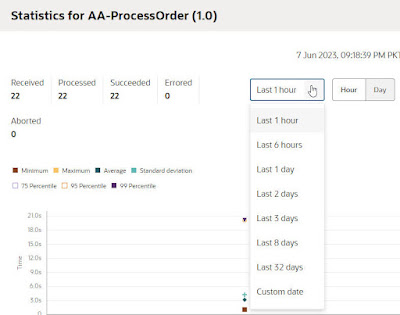
Naturally, I can also vary the timeframe -


No comments:
Post a Comment